After 5 Straight Months of Decline – Plan Your Move and Understand the Pulse of Nifty
The Indian stock market, led by the NIFTY 50 index, has experienced a sharp downturn, with five consecutive months of declines testing the patience of investors. As market sentiment weakens, it is crucial to understand the technical levels that will shape future price action and guide your next move. This article dissects the NIFTY 50 monthly chart, highlighting key levels, critical signals from the Ichimoku Cloud, MACD, and offering a comprehensive trading plan.
NIFTY50STOCK MARKETANALYSIS
3/3/20252 min read
Understanding the NIFTY 50 Monthly Chart: Key Levels and Indicators
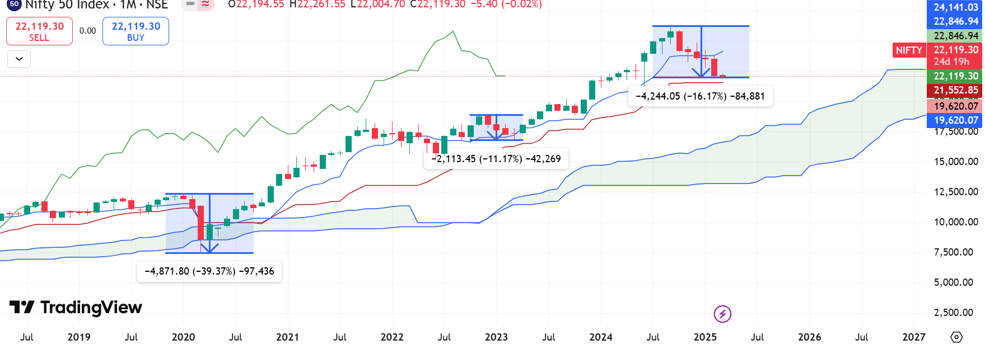
Key Support and Resistance Levels
Resistance Levels:
24,141 – Major Resistance
22,846 – Immediate Resistance (Kijun-Sen – Key mid-term level)
Support Levels:
22,143 – Critical Short-Term Support (Flat Kijun-Sen – Major pivot point)
21,552 – Immediate Support (Tenkan-Sen – Short-term baseline)
19,620 – Long-Term Support (Lower boundary of the Ichimoku Cloud)
Ichimoku Cloud Insights
The Ichimoku Cloud serve as a leading indicator offering a broader perspective on price trends and future support/resistance levels.
Bearish Signals:
NIFTY 50 is below the Tenkan-Sen (21,552), indicating a short-term bearish trend.
Price is approaching the Kijun-Sen (22,846) – a reclaim of this level is critical for any bullish reversal.
Bullish Hope:
The green cloud (Kumo) extending into 2026 suggests long-term structural support around 19,620.
MACD (12,26,9) Analysis
The MACD indicator is flashing clear signs of weakening momentum:
Bearish Crossover: The MACD line is below the signal line, confirming negative momentum.
Deepening Red Histogram: Suggests increased selling pressure and further potential downside.
Analyzing the Downtrend: What Does 5 Consecutive Months of Decline Mean?
The sustained downtrend over the past 5 months reflects a mix of:
Global Economic Concerns – Inflationary pressures and rising interest rates.
Domestic Factors – Profit booking near all-time highs and liquidity outflows.
Sentiment Shift – Increased uncertainty reflected by technical breakdowns.
Why the Next Move Matters
With NIFTY 50 hovering around key support zones, the next few months will determine whether the market stabilizes or enters a deeper correction.
Strategy: How to Plan Your Next Move
For Bulls (Optimistic Outlook):
Reclaim of 22,846 (Kijun-Sen) will open the door for a rally toward the 24,141 level.
Look for positive MACD crossover and price stability above the cloud for further confirmation.
For Bears (Cautious Approach):
A break below 21,552 (Tenkan-Sen) signals continued weakness, with the 19,620 cloud base as the next key target.
Watch for MACD divergence and a deeper red histogram as signs of further declines.
Neutral or Range-bound:
If NIFTY hovers between 21,552 and 22,846, expect sideways consolidation before a decisive breakout.
Conclusion: Stay Vigilant and Adapt
The 5-month downtrend in NIFTY 50 has raised concerns, but informed traders can navigate this market by focusing on critical support and resistance levels. Whether you're bullish or bearish, monitoring key indicators like the Ichimoku Cloud and MACD will provide valuable insights for making smart moves.
Actionable Takeaways:
Above 22,846: Bullish continuation towards 24,141.
Below 21,552: Deeper correction toward 19,620.
Stay Flexible: Adapt your strategy to technical developments and market sentiment.
As the market continues its unpredictable journey, staying informed and disciplined will help you succeed.
Disclaimer: This article is for educational purposes only and reflects the author's understanding of the market. It should not be interpreted as financial advice or a recommendation to buy or sell any securities. Always conduct your own research and consult a professional financial advisor before making investment decisions.
Learn
Empowering you with stock market education and insights.
Subscribe
© 2025. All rights reserved.